

")
This article is written by Ranojoy Middya pursuing Diploma in Companies Act, Corporate Governance and SEBI Regulations from LawSikho.
Table of Contents
Introducing balance sheet as company’s account
A balance sheet of any company usually contemplates a list of such a company’s total assets, debt, and shareholder equity that eventually provide the financial condition of the said company at any given period of time. In its factual expression, the balance sheet is all about a fundamental equation whereas the total assets of the company consolidate the total liabilities as well as equity of the said company (assets = liabilities + equity). Often described as one of the statements of the financial position of a company, the balance sheet provides all the required information related to analyzing the financial stability and performances related to the businesses. On the legislative front, Section 129 of the Companies Act 2013 hereby mandates the preparation of a balance sheet which, inter alia, indicates the solvency, profitability, and liquidity position of the company.
What is the balance sheet?
The balance sheet having been widely considered as a snapshot of a moment in time and consisting of two parts constitutes a special overview in itself. The first left-side contemplating the assets of the company contains a list of everything that the company has along with its corresponding value attached therein. On the contrary, the right side of the sheet defines the equity and liabilities of the company which upon consolidation forms an overview with all those parties with respect to their individual claims to the company and the extent to which such claims exist for the said company in concern. The assets and liabilities, as mentioned above, are further separated into two categories with respect to its current assets or liabilities and non-current (long-term) assets or liabilities. To be more precise, liquid actions such as inventory, cash, and trades payables, are supposed to be placed in the current section before illiquid accounts (or non-current) such as plant, property, and equipment (PP&E) and long-term debt.

Financial management and its three major overviews
Companies usually report their financial situation annually in the form of financial statements which further depends upon the nature and size of the companies. Small companies often do that in relation to their tax authorities whereas large companies tend to inform their respective owners or other interested parties through making such annual reports that consist of information from the Board of Directors, the Supervisory Board, a statement from the auditor, and the financial statements. This structure of financial management consisting of the profit and loss statement, the cash flow statement, and the balance sheet of any company, remains the same throughout the world.
Whereas the profit and loss statement appears to be the most discussed financial overview that provides insights into the profitability of the activities of the company. The cash flow statement, on the contrary, provides insights into the money flows in and out of the company in a specific period of time in concern. Having said that, both the profit and loss and the cash flow statement as mentioned above, emphasize the events describing a specific time period. The balance sheet along with its one-of-a-kind special characteristics, speaks of the specific moment of time. In the said context, the balance sheet, in a nutshell, represents a snapshot of all the assets, equity, and debts that the company has at a given moment in time. Hence, the balance sheet as part of the annual report of any company, at the beginning of the period compared with the second version of it at the end of the said period can be a useful parameter to assess the performance of the said company in concern.
The structure of the balance sheet
As per Section 129 of the Companies Act, 2013, a financial statement must ensure a true and fair view of the company affairs that too in conformity with the accounting standards notified under Section 133 of the act and that statement must be in form or forms provided for different class or classes of companies prescribed under Schedule III of Companies Act 2013. As per the schedule mentioned, the financial statement here refers to the disclosure of the balance sheet and the statement of profit and loss as prescribed therein. Having said that, the structure of the balance sheet, like all financial statements, must have minor differences between organizations and industries. The major three pillars of a balance sheet of any company, in this regard, are assets, liabilities, and equity. However, several buckets and line items that are very common these days in a balance sheet shall be discussed briefly under current assets, long-term assets, current liabilities, long-term liabilities, and equity.
The assets
As we have already discussed, the left side of the balance sheet is known as assets with all other items described that are further in the possession of the company with the value as stated in the books. The said value can be of two ways, either by the original value with the depreciation to deduct or the current value only which is the sum of the previous two. Differentiation between the assets can further be done in various ways. Some common ways have been dealt with in details herein below for your reference;
-
Current assets
Current assets of any company consist of cash and equivalents, accounts receivable, and inventory.
1. Cash and equivalents
Firstly, the cash here defines to be the most liquid of all assets which appear on the first line of the balance sheet whereas the cash equivalents define to be the assets that have short-term maturities under three months or assets like marketable securities that the company can liquidate on short notice. Companies, in the given scenario, usually disclose their respective equivalents in the footnotes of the balance sheet.
2. Accounts receivable
Next, the account as one of the current assets incorporates the balance of all the sales revenue still on credit along with the net of any allowances for doubtful accounts which is considered to be generating bad debt expense for the company. However, with companies recovering the accounts receivables decreases this account on one hand and increases the cash of the same amount on the other.
3. Inventory
And lastly, comes the inventory which includes amounts for all raw materials, work-in-progress goods, and finished goods. The company tends to use this account at times of reporting the sales of goods, generally under the cost of goods sold in the income statement.
-
Non-current assets
Non-current assets for any company include plant, property, and equipment(PP&E), and intangible assets.
1. Plant, property, and equipment
As far as the PP&E is concerned, it captures the company’s tangible fixed assets which are further noted net of accumulated depreciation. A few companies class out their PP&E by the different types of assets, such as land, building, and various types of equipment. All PP&E is subject to depreciation except for land.
2. Intangible assets
On the other hand, intangible assets incorporate all of the company’s intangible fixed assets, which may or may not be identifiable. Identifiable intangible assets include patents, licenses, and secret formulas. Unidentifiable intangible assets include brand and goodwill.
The equity and liabilities
Since we have already discussed the Assets part of a balance sheet which merely emphasizes what a company has on the left side of the sheet, the right side hereby defines the liabilities of the said company which merely delineates ‘to whom do such liabilities belong’. From a layman’s perspective, the right side of the balance sheet usually defines who has claims towards the company and to what extent such claims are payable by the said company. Liabilities of the company are usually segregated into the following two major groups;
-
Equity/shareholder equity
The equity part of the balance sheet belongs to the owner of the company which is why it is merely known as shareholder equity. As far as this group is concerned, it usually helps the company keep a tab on the distinguishing factor between what is invested by the owners, the share capital, and the profits as well as the reserves realized by the company itself in its past. Shareholder equity may further consist of share capital as well as retained earnings of the company.

Considering the share capital of any company, it usually talks about the funds that shareholders bring into the company through investments. At times when an investor forms a company and seeds it with 10 lakh of rupees, the total equity of such company then rises up to Rs. 10 lakhs for both the share capital and cash of the said company, and that simultaneously balances out the respective balance sheets.
On the other hand, retained earnings entail the total amount of net income that the company decides to keep. As per the Rules of Companies Act, 2013, the company in each year must be liable to pay out dividends from its net income. Any amount remaining or exceeding the particular amount shall be added to the ‘deducted from retained earnings’ section of the balance sheet.
The liabilities
The second group hereby defines the liabilities of the company in favour of various lenders and debt providers. It further consists of several Banks, private providers, and mainly the suppliers to whom the company owes a certain amount of money from a large part of its debt. There are also two major segmentations; current liabilities and non-current liabilities; through which the entire liability structure of any company pans out in the balance sheet.
-
Current liabilities
Current liabilities of any company usually include accounts payable, current debt/notes payable, and the current position of long-term debts.
1. Accounts payable
Accounts payable which is also known as AP majorly deals with an amount a company owes to its Suppliers for certain items or services being purchased on credit. As soon as the company pays off the AP, it translates into the balance sheet in the form of a decrease in AP along with an equal amount of decrease in the cash account of the company as well.
2. Current debt/notes payable
On the other hand, current debts/notes payable may further include non-AP obligations that are due or outstanding on the account of the company for the last one year or within one operating cycle (whichever is the longest). Notes payable on the contrary may have their own long-term vision such as notes with a maturity of more than a year.
3. Current position of long-term debts
Last but not the least, the current position of long-term debt defines the obligation of the company towards paying off the current portion of the long-term debt owing to its specific portion due for that year in concern. It usually talks about the portion due in a piece of debt that has a maturity of more than a year. Say for example, if a company takes a bank loan that needs to be paid off in 5 years, this account of the said company will include a certain portion of that loan due every year till the completion of the said 5 years.
-
Non-current liabilities
Non-current liabilities of any company further include bonds payable and long-term debt.
1. Bonds payable
Bonds payable are the bonds issued by the company to generate cash or funds for the company. By the said issuance of bonds, the company becomes the borrower hence attracts certain liabilities towards itself. Therefore, bonds payable commonly lie on the liability side of the companies’ balance sheets. And generally, it falls in the non-current class of liabilities.
2. Long-term debt
In addition, long-term debt is nothing but an account that includes the total amount of long-term debt of the company. It majorly excludes the current portion of the debt only in case of that account being present under the current liabilities. The said account is usually derived from the debt schedule of the company which outlines all the company’s outstanding debt, the interest expenses, and the principal repayment for every period.
How is the balance sheet used in financial modelling?
Balance sheets play an integral part in determining the financial position of any company. This document is majorly used by the analysts who generally make use of the balance sheet to calculate a bunch of financial ratios that eventually help determine the performing metrics of the company while stressing upon the solvency and efficiency status of the said company in concern.
Any changes or alterations in the balance sheet accounts are highly instrumental in calculating cash flow in the cash flow statement. At the time of any positive change to plant, property, and equipment, the balance sheet gets equal to the subtraction of capital expenditure and depreciation expense. And in case if the same depreciation expense is widely known to the public, the capital expenditure can not only be calculated but also be incorporated as a cash outflow under the ‘cash flow from investing’ section of the cash-flow statement.
Equivalence of balance sheet
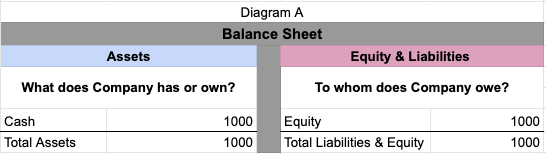
The equivalence of balance sheets seems to be of utmost importance keeping in mind the values it carries with respect to the financial standings of any company. As we all are pretty aware by now that the balance sheet has two major sides, the one deals with the assets part of any company, and the other counterpart deals with the equity and liability part of the same company. The assets part of any company defines ‘what the company has or owns’ and the equity and liability part of it describes ‘what the company owes’. Therefore, here the term ‘equivalence’ must always be established in between both these parts or sections in order to balance out the balance sheet. Let us understand the same with an example.
For example, there is a private balance sheet, and I, while starting a business, deposit the amount of Rs. 1000/- in the new company bank account. Given this situation here, the balance sheet is shown in diagram A.
Now suddenly, I have decided to purchase a building that cost me around Rs. 2000/- So, I have completed the said purchase with the earlier Rs. 1000/- that I have deposited in the bank and then for the remaining amount I have managed the finances with a mortgage. For this situation, here the balance would be the same as diagram B.

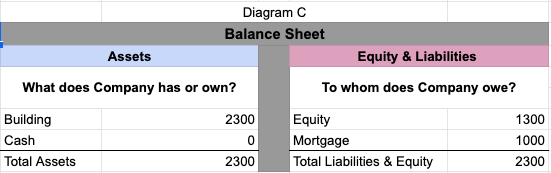
Now for unknown reasons, the value of the purchased building has increased to Rs. 2300/- and the mortgage remains the same hence the shareholders seem to be happy as you can see in diagram C.
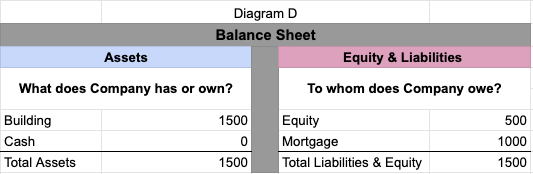
And after a few days, the situation gets reversed where the value of the building decreases to Rs. 1500/- and the mortgage as always remains the same but the shareholders this time don’t seem to be happy as shown in diagram D.
Balance sheet as ‘parking lot’ for financial managers
The balance sheet is often regarded as a ‘parking lot’ for most financial managers. The reason behind such connotation hereby describes an interesting concept. As we have already discussed, when it comes to the financial management of any company, there are only 3 major pillars on which any financial structure can be built. These are none other than the profit and loss statement, the cash flow statement, and the balance sheet.
The profit and loss statement usually speaks about the realization and consumption of the company. The major understanding behind it is determining what has been delivered and what has been used or consumed by the company. On the other end, the cash flow statement defines the flow of cash in the company. It further helps entities determine how much money has come into the company in the form of cash inflow and how much money has left the company in the form of cash outflow. Therefore, instances, where activities take place within the company that does not lead to any sort of consumption or realizations and at the same time, do not even ensure any sort of cash going in or out, usually call for a place to park such activities. Given the above context, the balance sheet provides such parking lot to all the financial persons for keeping a comprehensive record of all such activities that are neither part of the profit and loss statement nor the cash flow statement. Let us refer to one of the examples which would make the concept clearer.
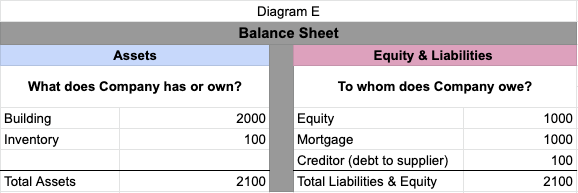
For example, Z being a trade organizer has decided to buy chairs amounting to Rs. 100/- for his business. At the time of receiving the delivery of such chairs, Z stored all the chairs in the warehouse. Now given the situation here, Z not only creates an asset in the inventory but also incurs a debt towards the supplier of such chairs. Having said that neither does it ensure any realization by means of the sale nor is there any payment made to the supplier, hence the activity will not be having any entry with respect to the profit and loss statement as well as the cash flow statement due to the fact that no payment has yet been made to the suppliers. (Refer to diagram E).
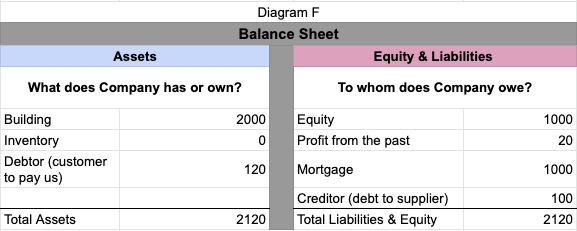
Now Z delivers the chairs for Rs. 120/- to a customer and by doing that he realizes an activity in favour of his profit and loss statement. As a result, Z’s company no longer owns the chairs, and nor the chairs are part of his inventory anymore. Above all, Z has a claim towards his customer now as the customer still has to pay him for the chairs in the coming future. (Refer to diagram F).
Let us consider a moment where the customer pays for the chairs to Z. Now with this payment, there has been a cash inflow that would be included in the cash flow statement. At the same time, Z’s claim on the customers also expired and Z got some cash in his hand instead. (Refer to diagram G)

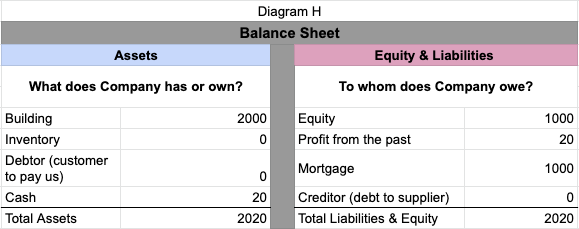
Z now pays his suppliers the bills for the chairs and generates a cash outflow on the cash flow statement. By doing so, Z’s cash got lower on the balance sheet but the debt is also gone. (Refer to diagram H).
Importance of the balance sheet
After getting a thorough understanding of how the balance sheet works, let us now understand its importance from a company’s perspective. The balance sheet has always been regarded as one of the integral financial statements. Despite being highly substantial on its own, the balance sheet, if it is in conjunction with other statements like the income statement and cash flow statement, can be of utmost use in determining a clear picture of a company’s health. Having said that, there are almost four financial performance metrics that can be achieved through a proper balance sheet. Let us understand these metrics:
Liquidity financial metrics
When it comes to ascertaining liquidity financial metrics, a company’s current assets must be compared with its current liability whereas the current assets have to be greater than the current liability of the said company in order to fulfill the short-term obligations of the said company. Two of the major examples of liquidity financial metrics are the current ratio and the quick ratio.
Current ratio
The current ratio is usually known as the working capital ratio which helps in measuring the capability of any business to fulfill its short-term obligations that are due within a year. This ratio compares the current assets with the current liabilities of the business for determining the financial health of the company so that it can maximize the liquidity of its current assets to settle the debts and payables.
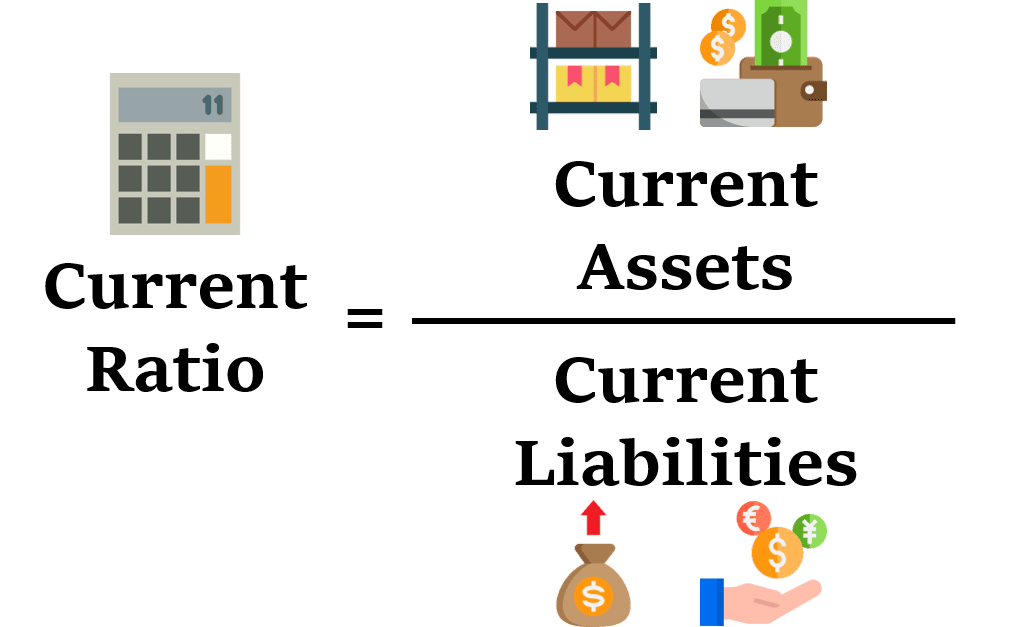
The current ratio formula is as follows;
Current ratio = current assets/current liabilities
Example of current ratio formula
Let us say, any business holds cash of 15 lakhs, marketable securities of 20 lakhs, inventory of 25 lakhs, and short-term debt along with accounts payable of 15 lakhs each. Given the situation, the current ratio would be as follows;
Current assets = cash + marketable securities + inventory = 15 + 20 + 25 = 60 lakhs.
Current liabilities = short-term debt + accounts payable = 15 + 15 = 30 lakhs.
Hence, the current ratio as per the above formula, would be as follows;
Current ratio = current assets/current liabilities = 60/30= 2.0x.
Given the above example, the current ratio of the business is 2 which means it has the capability to settle each lakh on loan or account payable twice. A rate of beyond 1 usually indicates the financial wellbeing of the company. Since there is no such upper-end with regards to anything as ‘too much, it usually varies with the industry. However, a very high ratio somewhere shows that the company might have excess unused cash in hand which can rather be used in investing to grow its business.
Quick ratio
The quick ratio, on the other hand, is known as the acid Test or liquidity ratio which helps in measuring the ability of any business to pay its short-term liabilities with the help of its assets that are readily convertible to cash. Few of such assets are cash, marketable securities, and accounts receivable. These assets are considered to be quick assets due to their ability to be promptly converted into cash.
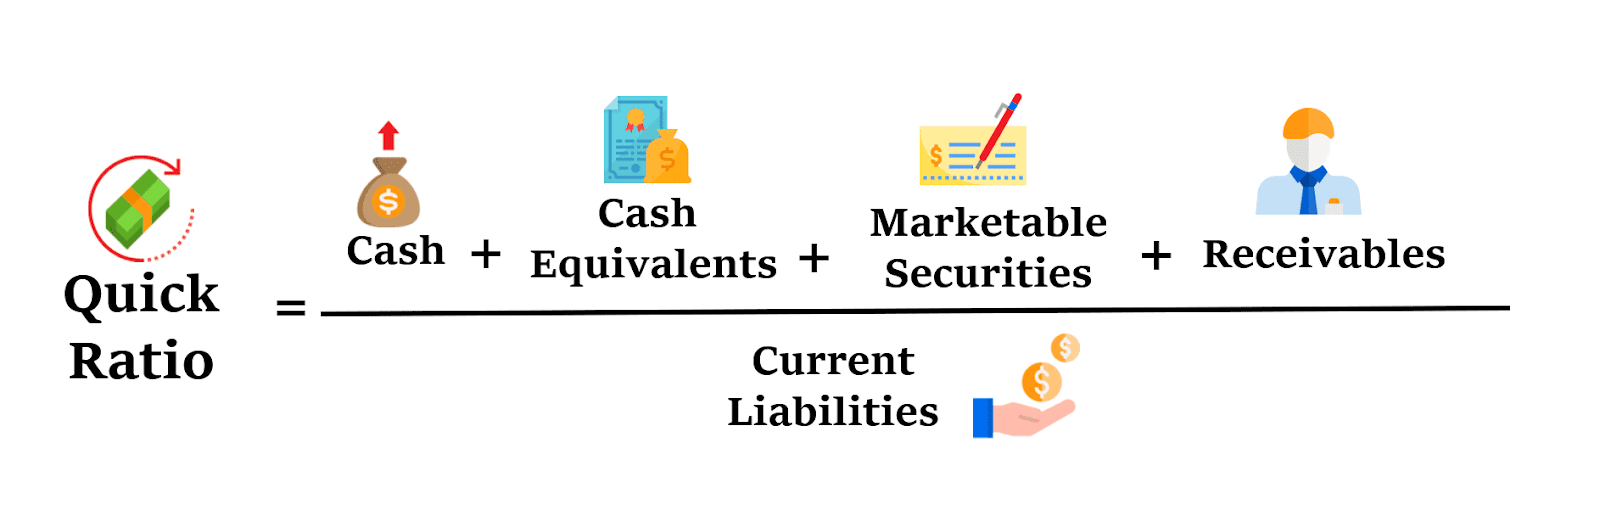
The quick ratio formula is as follows;
Quick ratio = [cash & equivalents + marketable securities + accounts receivable]/current liabilities.
Alternatively,
Quick ratio = [current assets – inventory – prepaid expenses] / current liabilities.
Example of Quick Ratio Formula
Let us say any company owns cash of 10 lakhs, marketable securities of 20 lakhs, accounts receivable of 25 lakhs, and accounts payable of 10 lakhs. Given the situation the quick ratio would be as follows;
Cash and equivalents = 10 lakhs
Marketable securities = 20 lakhs
Accounts receivable = 25 lakhs
Current liabilities = Accounts payable = 10 lakhs
Quick ratio = [10 + 20 + 25] / 10 = 55/10 = 5.5
Hence the company has a quick or liquidity ratio of 5.5, which ensures that the company can pay off its current liabilities 5.5 times over using its most liquid assets. Such a ratio beyond 1 is considered to be enough cash for any business to cover its short-term financial obligation and sustain its operation in the market.

Leverage
The financial condition of any company defines its leverages which indirectly ensure how much financial risk a company can take. Given the context, the assessment of leverages on the company’s balance sheet can be ascertained by comparing the debt to equity and debt to the total capital of the concerned company.
Debt to equity
The debt to equity ratio is nothing but a leverage ratio that helps in measuring the weight of the total debt and financial liabilities of any company against the Shareholder’s equity ratio of the same company. The debt to equity majorly deals with the total equity of the company whereas the debt to assets acknowledges the total assets of the company as a denominator. In addition, this leverage ratio has, over the years, evolved to such an extent that it helps companies in determining what would be the appropriate title of their capital structures. Should a company’s capital structure be influenced by its debt financing or its equity financing can now easily be construed through this debt to equity ratio.
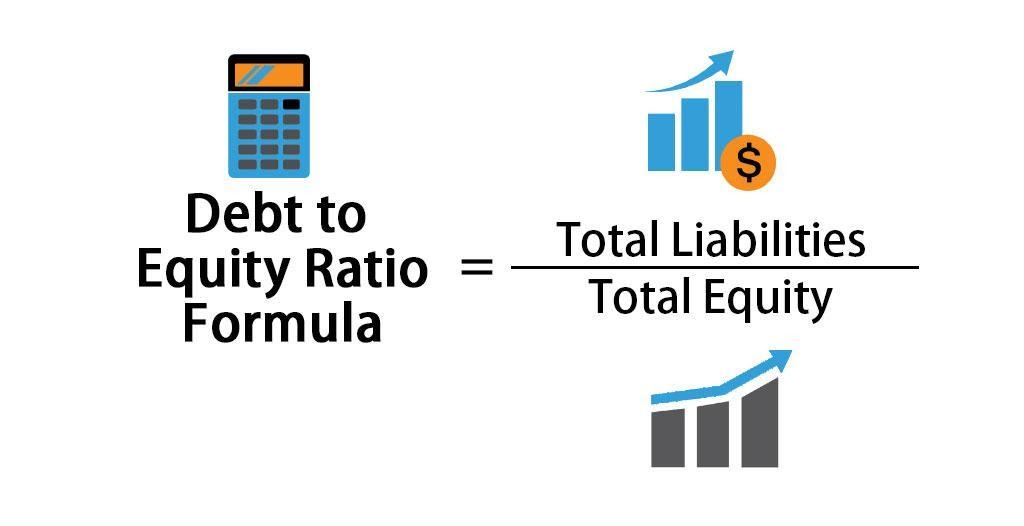
The debt to equity ratio formula is as follows;
Debt to equity = total debt/shareholder’s equity
Or,
Debt to equity = total debt (short term debt + long term debt + fixed payment obligations)/shareholders’ equity
Debt to equity in practice
In accordance with any balance sheet, if any company’s total debt stands to be worth 50 lakhs and the total equity stands to be worth 120 lakhs, the debt to equity of that company would be (total assets/total debts = 50/120) 0.042. The above situation envisages that for every one rupee of equity, the company acquires 42 paise of leverage, whereas the ratio of 1 would have brought the creditors as well as the investors into the same footing in the company’s assets.
A higher debt to equity ratio would label any company to be highly levered. This high ratio is only preferable for those bunch of companies that are stable with their significant cash flow generation but not at all preferable for companies in decline. However, the lower ratio hereby conversely indicates a company to be less levered and highly prone to be fully financed through its equity. Conclusively, the appropriate ratio in this regard would vary with the change in industries.
Efficiency
Efficiency metrics of any company with regards to its assets can be assessed through its income statement that is eventually connected with the balance sheet of the same company. So, if you divide the revenue of the company with the average total assets of the same company, it would resultantly produce the assets turnover ratio which would further indicate how efficient the company is in turning its assets into revenue. In the same way, the working capital cycle deals with the company managing its cash in the short term.
Fixed assets turnover ratio
Fixed assets turnover is usually known as the FAT which is nothing but an efficiency ratio that indicates how diligently a company can make use of its fixed assets to generate sales for the company. This ratio, in the said context, gets calculated over an annual period where a company divides its net sales with its net fixed assets. The net fixed assets hereby include a bunch of metrics such as the amount of property, plant, and equipment, less the accumulated depreciation.
The fixed assets ratio could be of various characteristics. Normally the higher asset ratio enables the company to utilize effectively on its investments in fixed assets to generate revenue. This ratio is usually analyzed alongside leverage and profitability ratios.
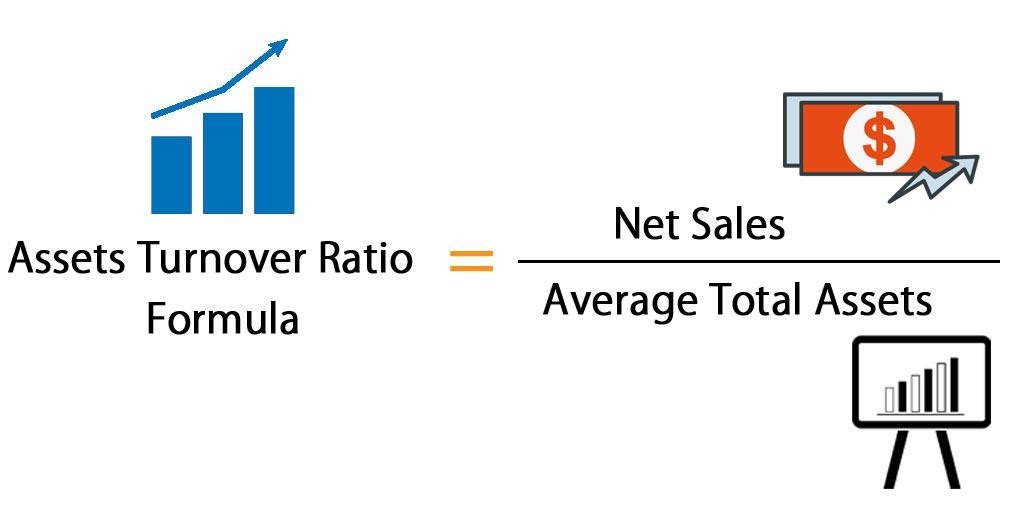
Fixed asset turnover ratio formula;
To determine the fixed asset turnover ratio, the following formula is used;
Fixed asset turnover = net sales/average fixed assets
Example of fixed assets ratio calculation
Say, for example, a Fisher Company bags an annual gross sales of $10M in the year 2015, while the sales returns and allowances of the company have been $10,000 in the same year. Now the beginning balance of its net fixed assets was $1M, and the year-end balance amounts to be $1.1M. On the basis of such given figures, the fixed asset turnover ratio for that year, in particular, turns out to be 9.51, which indicates that for every one dollar invested in fixed assets, a return of almost ten dollars has been earned. On the other hand, the average net fixed asset can be ascertained by adding the beginning and ending balances, then dividing that number by 2.
Working capital cycle
The working capital cycle for any business defines the length of time this particular business is going to take for putting across the conversion of its total net working capital into hard cash. Most businesses usually take control of this cycle by selling their inventory quickly, collecting revenue from customers quickly, and paying the bills slowly in order to optimize the flow of cash.
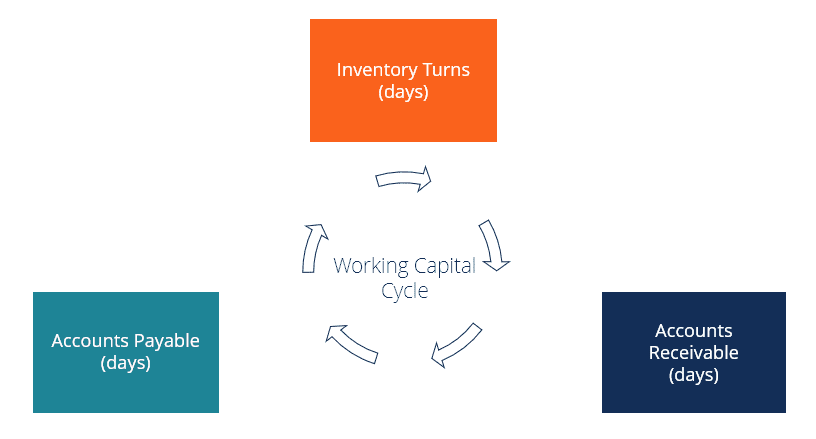
There are few steps with regards to this working capital cycle:
- Firstly, a company without dispensing any cash, purchases materials on credit (mentioned under accounts payable) for manufacturing of a product. In this scenario, the company receives a timeline of 90 days to pay for the raw materials (payable days).
- Secondly, the said company now sells its newly built inventory in 85 days, on average (inventory days) but the company doesn’t receive the cash for them immediately as they are sold on credit too (under accounts receivables).
- Thirdly, the said company receives the pending payment from customers for the products sold in 20 days, on average (receivable days) and that’s how the working capital cycle of the company gets completed.
Working capital cycle formula:
Working capital cycle = inventory days + receivable days – payable days
Hence given the above situation, the working capital cycle ratio of that company would be as follows;
Inventory days = 85 days
Receivable days = 20 days
Payable days = 90 days.
Working capital cycle = 85 + 20 – 90 = 15
This means the company would only be out of cash for 15 days before receiving the full payment. Whereas the negative working capital cycle hereby defines the company to have received the payment from a customer before the payment date of its suppliers.
Rates of return
When it comes to the balance sheet, it usually helps in evaluating how well the company generates returns. Therefore, if you divide the net income with the shareholder’s equity, it would produce a return on equity (ROE), and dividing net income by total assets would further bring you the return on assets (ROA), and dividing net income by debt plus equity would result in a return on invested capital (ROIC).
Return on equity (ROE)
Return of equity or ROE is usually considered to be the end result of a company’s annual return which is often known as net income of any company, divided by the value of its total shareholder’s equity. The ROE is majorly expressed in percentage only, likewise 12% for that matter. The derivation of ROE usually consists of a two-part ratio as it brings together the income statement as well as the balance sheet which further helps the company to compare its net income or profit with its shareholder’s equity. The number, given the context, defines the total return on equity capital and at the same time ensures the firm’s ability to turn equity investments into profits.
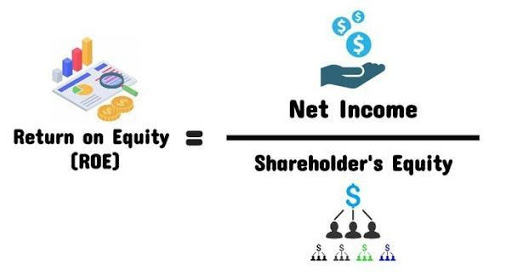
ROE formula;
ROE = net income/shareholders’ equity
What does ROE provide?
ROE provides a simple metric that evaluates the investment returns of the company. Just on the basis of a comparison between a company’s ROE and the industry’s average, one can easily pinpoint the company’s competitive advantages. The ROE can also be instrumental in determining how the company management is financing from its equity to expand the business.
The more sustainable and increasing the ROE becomes, the better the company generates shareholder value as it helps reinvest its earnings wisely just to ensure an increase in productivity and profits. On the contrary, a declining ROE usually reflects the poor decision taken by the management on reinvesting capital in unproductive assets.
Return on assets (ROA)
Return on assets (ROA) is one of the major types of return on investment (ROI) metrics that helps in measuring the profitability of a business with respect to its total assets. This ratio determines the performance of a company by comparing the profit that the company generates along with the capital that the company invested in assets. The higher the return would be, the more productivity and efficiency would reflect upon the management of the company utilizing its economic resources. Below we have mentioned the breakdown of the ROA formula and calculation.
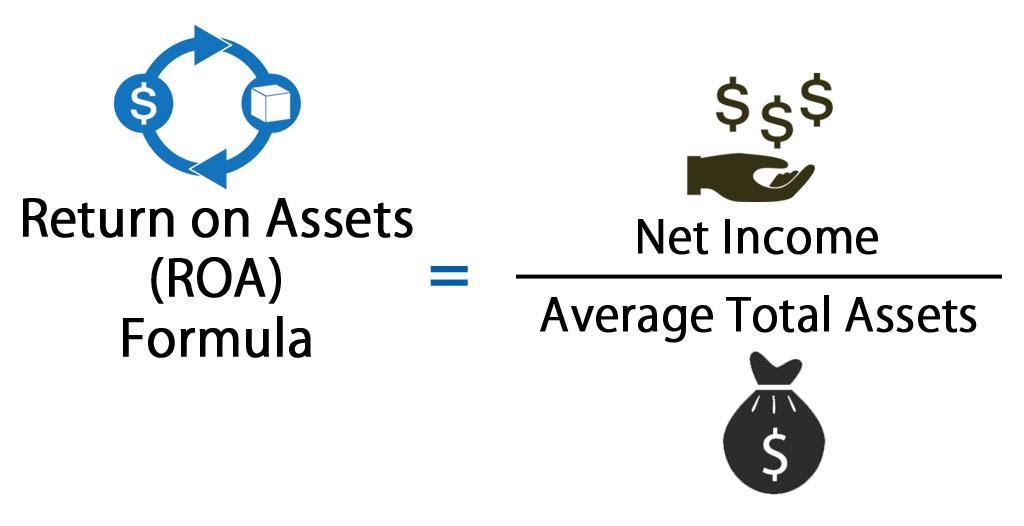
The ROA formula is;
ROA = net income/average assets
Or,
ROA = net income/end of period assets
Example of ROA calculation
Let us consider the step-by-step process of how to calculate return on assets using the formula above.
For example, if a business bags a net income of $10 million in its current operations, and owns $50 million worth of assets according to its balance sheet, the return on assets given the situation would be $10 million divided by $50 million that is 0.2. Therefore the business’s ROA would be 20% which means for every dollar of assets the company invests in, it adds to 20 cents in net profit per year.
Return on investment capital (ROIC)
Return on invested capital, known as ROIC, is mostly reckoned as profitability or performance measure of the return earned by those who provide capital, likewise the firm’s bondholders and stockholders. Return on invested capital (ROIC) can be defined as follows:
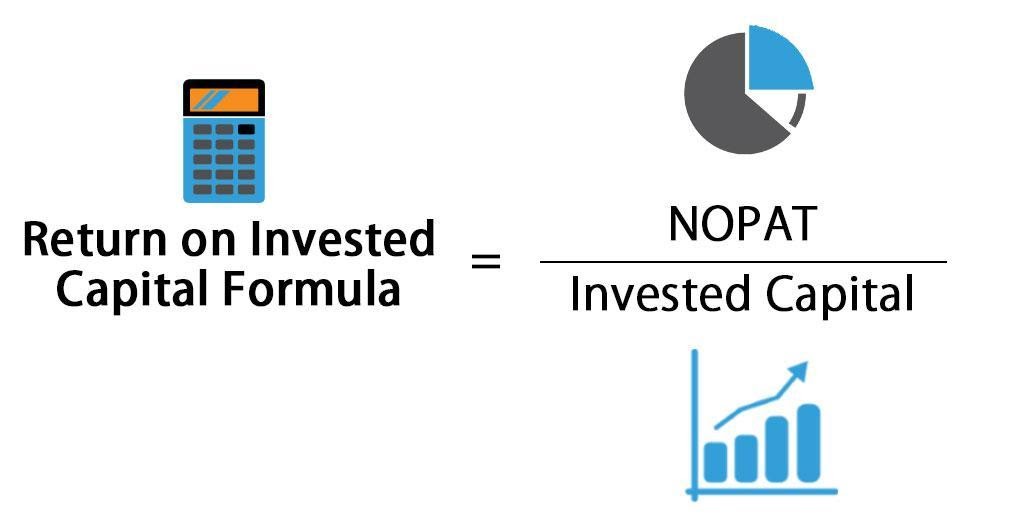
The major three key insights to be gained from this definition are as follows:
- Usage of after-tax operating income (NOPAT) rather than net income to consider earnings to not only be in favour of stockholders (net income) but also to be in favour of bondholders (interest).
- Usage of the book value of debt and equity as compared to the market value because market value signifies expectations for the future, whereas the book value accurately indicates current profitability by removing these expectations. Furthermore, it also helps in netting out cash because the interest income generated from cash can in no way be a component of operating income.
- The timing difference is of utmost significance here as the capital must always be invested before the earnings generated out of such invested capital take place. Given the context, some analysts sometimes feel it necessary to take an average of the invested capital amount in the prior and current periods.
Conclusion
Since we are already apprised of various factors involved in the balance sheet, it is now highly imperative to take note of fact that issuance of the balance sheet must be undertaken after ensuring the accuracy of all the amounts being reported in the sheet. Having said that, here I have enlisted two of the major recommendations which can be useful in achieving the said accuracy standard;
- It is always preferable to have a detailed analysis of the amounts reported on earlier balance sheets along with the amounts reported in the present one.
- It is indispensable for the balance sheet to be in conformity with the supporting work papers and other relevant documentation of the company in concern.
- The amount of cash and cash equivalents must be in consonance with the bank reconciliations for the company’s bank accounts.
- Accounts receivable net must be decided in comparison with the aging of accounts receivable.
- Inventory must emanate from a schedule of calculations to support the cost reported as inventory.
- The number of prepaid expenses should adhere to work papers showing the calculations of the amounts that had been paid in advance and are still prepaid as of the date of the balance sheet.
- Accounts payable must be in consonance with a listing of amounts owed.
- Accrued liabilities should adhere to work papers showing the calculation of the amounts owed but have not yet been recorded.
- Deferred revenues must be in consonance with work papers documenting the amounts received from customers in advance but have not yet been earned.
Reference
- https://peakbusinessvaluation.com/the-value-of-efficiency-ratios/
- https://www.bluelinecapital.co.za/return-on-invested-capital/
Students of Lawsikho courses regularly produce writing assignments and work on practical exercises as a part of their coursework and develop themselves in real-life practical skills.
LawSikho has created a telegram group for exchanging legal knowledge, referrals, and various opportunities. You can click on this link and join:
 Serato DJ Crack 2025Serato DJ PRO Crack


 Allow notifications