


This article has been written by Nikhil Isaac, pursuing a Course on Training Program to Crack the Independent Directors’ Exam. Nikhil is a Real Estate strategy specialist who is also an aspiring Independent Director.
The article has been and edited by Shashwat Kaushik and published by Rachit Garg.
Table of Contents
Introduction
The age-old adage “Location, Location and Location” has stood the test of time. But caveats pop up regularly. New infrastructure developments like a flyover or a business park could alter the neighborhood’s attractiveness. Urban planners always think of ideas like satellite towns and alternate connectivity modes to decongest and drive demand away from congested core areas.

Spatial Dependence in Real Estate refers to the phenomenon where the values of neighbouring properties influence the value of a property. The concept is rooted in the belief that properties in close proximity tend to have similar characteristics, which impact their prices. In this discussion, the viewpoints of key stakeholders are analysed along with the resulting price implications for the consumer.
What is spatial dependence
The study of spatial analysis can be conducted on various parameters, like geographic, economic, and topological. Every geographic point has some degree of uniqueness. Spatial dependency parameters can either be positively or negatively correlated. Therefore, spatial autocorrelation is required for regression models.
A famous use case of spatial analysis was by Dr. John Snow, a British physician, who identified the source of cholera in the London epidemic of 1854. Dr. John Snow used mapping and spatial analysis to identify clustering patterns of this disease around water pump locations in London.

Figure 1: A variant of the original map drawn by Dr. John Snow.
Spatial dependence in real estate
Spatial dependence is a critical factor in real estate market analysis as it helps investors understand market dynamics and make informed investment decisions. To borrow a concept from the field of winemaking, an analogy can be drawn with “Terroir”. Terroir is a French term that refers to Land and the sense of place. The terroir of every place on Earth is unique, as no two places have the same geography, climate, or topography. Urban Agglomeration economies result from businesses and amenities clustering together, creating a positive impact on property values. The desirability of neighbourhoods depends on locational attributes like proximity to schools and access to transportation.
Real estate valuation
In a real estate property valuation, a simple but powerful valuation method is the “Comparable Method”. Prices of similar properties in similar locations are used as reference benchmarks. A trained valuer will identify key property attributes and factor premium or discount factors to compare and arrive at the right property value accurately.
The simplicity of this valuation method is also the reason behind its success, especially for under-development or empty properties. By considering this spatial dependency component, the comparable method or market data approach can be strengthened.
Measuring spatial dependence and econometrics
Several statistical techniques are available. The most commonly used technique is spatial autocorrelation analysis, which examines the similarity of property prices within a given locality. It helps identify spatial patterns and clusters of high or low property values. The primary measures of autocorrelation analysis are Moran’s I and Geary’s C.

Moran’s I
Moran’s I measures the overall spatial association between property values, ranging from -1 (indicating complete dispersion) to +1 (complete spatial dependence). A positive Moran’s I suggests positive autocorrelation, which indicates high-value properties tend to be located near other high-value properties, while low-value properties tend to be close to other low-value properties.
Geary’s C
Geary’s C is another spatial autocorrelation factor, ranging from 0 (complete spatial dependence) to 2 (complete spatial dispersion). A low Geary’s C indicates positive spatial autocorrelation, which clusters properties with similar property values.
Spatial Regression Models (SRMs) are used to understand the relationship between property prices and various factors of spatial dependence. Spatial Dependence correlates with housing affordability indexes. Using spatial econometric techniques provides a powerful tool for understanding the complexities of property pricing. Through these models, the strength and direction of spatial dependence can be determined. Hotspots and clusters of similar prices can be identified. This information is vital for policymakers, real estate investors, and developers, as it allows them to target specific locations and neighbourhoods for investment options or potential for revitalisation.
Willingness to pay
The “willingness to pay” of potential consumers compliments the supply-demand characteristics of that market. There is a positive correlation between property prices and a high perceived liveability index. Amenities like schooling, public transportation, supermarkets, retail malls and other amenities have a positive impact on demand and prices. In the UK, property prices are positively correlated with factors such as educational institutions and pubs.
Proximity premiums for views of natural water bodies like lakes are factored into property price models. These models predict the willingness to pay more for access and views. Using mapping tools like GIS (Geographic Information System) and LIDAR (Light Detection and Ranging), geographical references can be tagged for pricing purposes. LIDAR is a remote sensing method that provides an accurate representation of the topography and vertical components of the landscape.

Impact of spatial dependence on key stakeholders
A few examples from across the world have been used to illustrate the significance:
- The San Francisco Bay Area is known for its sky-high property prices, driven by strong spatial dependence. Neighbourhoods like Silicon Valley, near major global tech giants, have experienced significant price appreciation, making housing unaffordable for many residents. The spatial dependence exacerbates the affordability crisis as high demand drives up prices across this region. Blue-collar workers bear the brunt as they cannot find affordable housing within their proximity.
- London faces an identical challenge, as central areas like Mayfair and Kensington are in high demand due to their cultural significance and prestige. Property prices across the neighbourhood are high, making rental options or homeownership unattainable for the vast majority.
The prism of spatial dependence is best understood by looking at the issue from the viewpoints of various stakeholders. Appreciating various viewpoints helps stakeholders develop innovative, win-win solutions.
Viewpoints
Policy makers
Spatial dependence can cause disparities in housing affordability. In areas with high spatial autocorrelation, prices are closely related, and therefore housing affordability can be a challenge. For example, in major cities like New York or London, properties in desirable neighbourhoods are highly valued, and housing affordability for residents is a major challenge. Issues like displacement of low-income residents, gentrification, and a lack of housing options for essential workers need to be addressed. Policymakers encourage mixed development through zoning regulations and targeted assistance for a more balanced community.
Studies have shown that spatial dependence exists in both urban and rural areas. Proximity to city centres, employment hubs, and school districts has a significant influence on urban areas. In rural areas, access to natural resources and scenic views can impact property prices. Spatial dependency is crucial not only for consumers but also for urban planners and policymakers. By recognising the element of spatial autocorrelation, policymakers can better allocate resources to improve existing neighbourhoods and plan future townships.
More importantly, areas that exhibit negative dependence must be targeted, thereby boosting property values. Nuisance elements and negative premium factors could be identified, and efforts could be made to mitigate these elements. Policymakers can use spatial dependence analysis to identify neighbourhoods that require targeted intervention. A negative spatial correlation could be corrected with specific revitalisation interventions. These initiatives can boost demand and property prices. Understanding the spatial correlation of property prices can be used for zoning regulations, transportation planning and the distribution of public resources for a more balanced community. Sustainable and equitable growth by enhancing the quality of these neighbourhoods.
Investors
Real Estate markets are influenced by many factors, and understanding the spatial dependence of property prices is critical for investment decisions. Supply and demand theory helps us understand some factors affecting real estate prices. This helps investors identify areas with high potential or areas that are currently undervalued.
Understanding how property prices are affected by neighbourhood factors helps long-term investors make informed decisions. Understanding potential drivers in the neighbourhood will be valuable while seeking long-term gains. By identifying spatial dependence and analysing historical data, predictive price forecasts can assess market potential. Price bubbles or market corrections can be forecasted.
Supply and demand
Demand and supply forces are needed to understand the pricing of real estate. The demand-supply graph shows the market equilibrium, where buyers are willing to buy and sellers are willing to sell. At the intersection, the price and the volume match, and there is equilibrium. Any point on either side of this intersection would represent a mismatch.
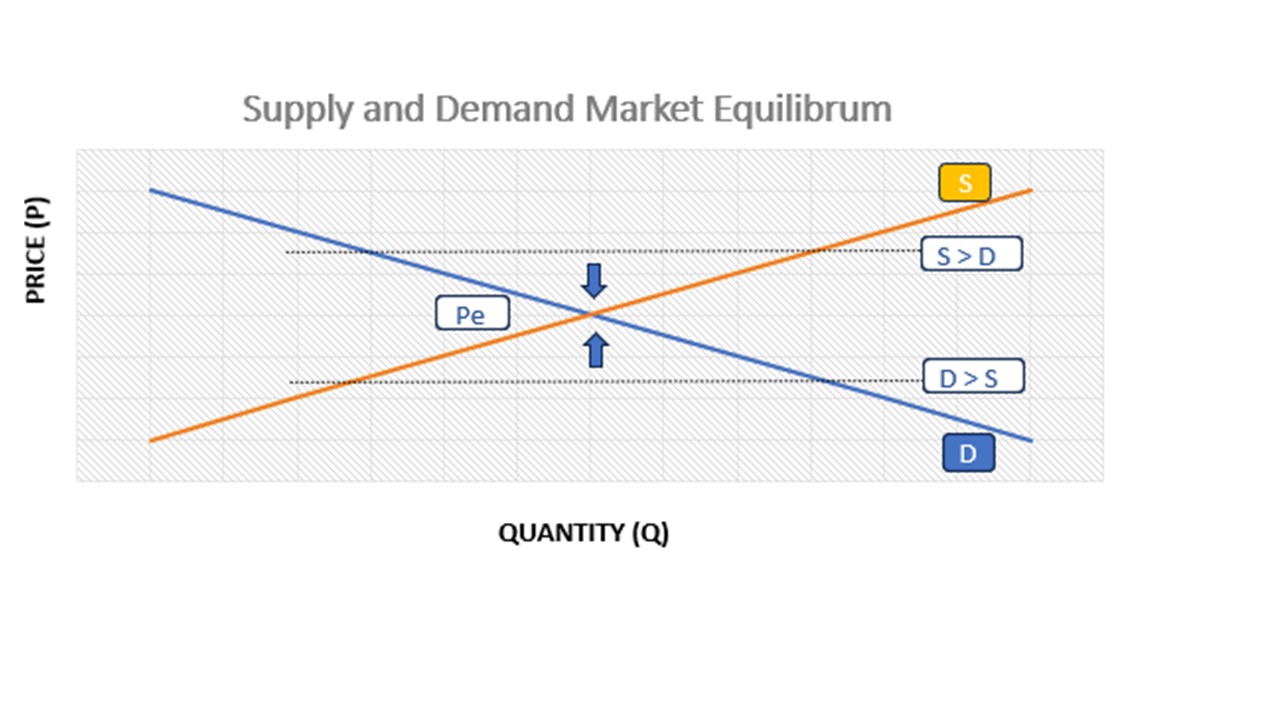
Figure 2: A graph illustrating the demand and supply dynamics.
The market is in equilibrium, with supply equal to demand. If prices are lower than equilibrium prices, then demand will exceed supply (D>S). This will create a shortage, pushing prices up to the equilibrium price. This is also called a sellers’ market.
The opposite happens when prices exceed the equilibrium price (S>D). There will be an oversupply, pushing prices down to the equilibrium price. This is called a buyer’s market.
If there is an overall increase in demand on account of population growth, income growth or other factors, the overall housing market will see upward demand growth. This results in the demand curve and the equilibrium price also moving upwards. Generally, income and population tend to increase with time, causing prices to move upward over time.
A change in construction costs, staff costs, or new design standards could cause a change in the supply curve. As the production cost increases, equilibrium prices move upward, affecting the demand curve. If a locality has land scarcity or strict development guidelines, the supply curve would have a steeper slope, and prices would increase rapidly over time.
Real estate developers
The neighbourhood of a property plays a vital role in its pricing. The social index of liveability and proximity of school districts and workplaces are vital to understanding that area’s demand. Property strategists must take cognisance of these factors while they conduct best-use feasibility studies for proposed projects. Unless their new project is massive in terms of scale and amenities, it might be difficult to change the underlying characteristics of a particular neighbourhood.
To analyse the spatial dependence of real estate prices, planners employ various statistical tools and econometric models. Studies carried out globally have confirmed the presence of spatial autocorrelation. This implies that properties in desirable neighbourhoods tend to exhibit positive spatial dependence, leading to high prices. These studies have shown that spatial dependence extends beyond directly adjacent properties. This spatial autocorrelation extends to properties several blocks away, which could present opportunities for developers. By considering the spatial context, developers can decide on property acquisition and development strategies.
Consumers
Both buyers and sellers should consider this spatial relationship while transacting real estate. Real estate prices tend to follow a K-type movement based on the quality of construction. New construction in the same locality has the competitive pressure to be similarly priced. But after a few years, developments with superior quality of construction and communities tend to command a significant price premium over the neighbourhood. Assessment of intangibles like the quality of the community is easier in developed neighbourhoods.
An interesting counterpoint is that of acceptability. Accessibility is the strongest in well-developed CBDs, but affordability has reduced drastically. The availability of land parcels for developing larger communities is a severe constraint. Does this mean the rich live close to the well-developed CBD areas while the poor live in distant suburbs? Like everything in life, the answer is not necessarily true.
The question arises would a person prefer a larger home with a long commute or a smaller home close to the workplace? Oftentimes, families make a conscious choice to move to greener spaces. Millennials and Gen Z have different approaches to investing compared to earlier generations.
Real estate price maps
Numerous factors have been discussed and numerous stakeholders’ viewpoints have been analysed. Bringing all these factors and viewpoints together, demand can be visualised using Real Estate Heat Maps. This Geo-visualisation (GVis) combines geographic information to include spatial analysis. Emerging micro-markets based on future growth can be visualised by identifying real estate trends. A property heat map helps investors discover emerging markets before they become investment hotspots. By identifying the hottest real estate markets early, stakeholders can capitalise on lower property prices and benefit from future growth.

Figure 3: An example of a property heat map pinpointing emerging markets.
Limitations and challenges
While spatial dependence provides valuable insights, it is not without challenges and limitations. A key challenge is the availability of accurate data. Data sources like the census for population numbers can be dated, especially in fast-growing cities with a high migrant population.
Another challenge is the identification of causal relationships. Spatial dependence helps identify associations between property prices but does not establish causality. Factors other than spatial proximity, like local amenities, may drive demand. No two properties in this world are identical, as the factors discussed in this paper can influence the overall product offering. The concept of terroir has been discussed, as have various factors that can influence the spatial dependence of the price of a particular property.
Conclusion
The economic value of spatial dependence on real estate prices reveals how impactful this element is. Integrating spatial dependence into statistical models helps enhance the accuracy of property valuations. The age-old real estate adage “Location, Location, Location” still holds. Ultimately, understanding spatial dependence empowers and contributes to improving neighbourhood communities and urban landscapes.
References
- https://predikdata.com/heat-maps-for-real-estate-investments/
- https://stats.stackexchange.com/questions/18406/what-is-the-difference-between-spatial-dependence-and-spatial-heterogeneity
- https://www.masterclass.com/articles/understanding-terroir-elements-of-a-wines-terroir
- https://thismatter.com/economics/market-equilibrium.htm
- https://www.mdpi.com/2073-445X/11/8/1320
- https://pearsonblog.campaignserver.co.uk/supply-and-demand-the-housing-market/
- https://www.mdpi.com/2073-445X/11/8/1320
- https://en.wikipedia.org/wiki/Moran%27s_I
- https://en.wikipedia.org/wiki/Geary%27s_C
Students of Lawsikho courses regularly produce writing assignments and work on practical exercises as a part of their coursework and develop themselves in real-life practical skills.
LawSikho has created a telegram group for exchanging legal knowledge, referrals, and various opportunities. You can click on this link and join:
Follow us on Instagram and subscribe to our YouTube channel for more amazing legal content.
 Serato DJ Crack 2025Serato DJ PRO Crack
")


 Allow notifications